Daily Energy Report
Impact of Shift to SUVs and Light Trucks, BP Reversal, Oil Prices, Solar, and more.
Outline
1- Chart of the Day
2- Story of the day
3- News of the day
CHART OF THE DAY: Long-term bullish for oil
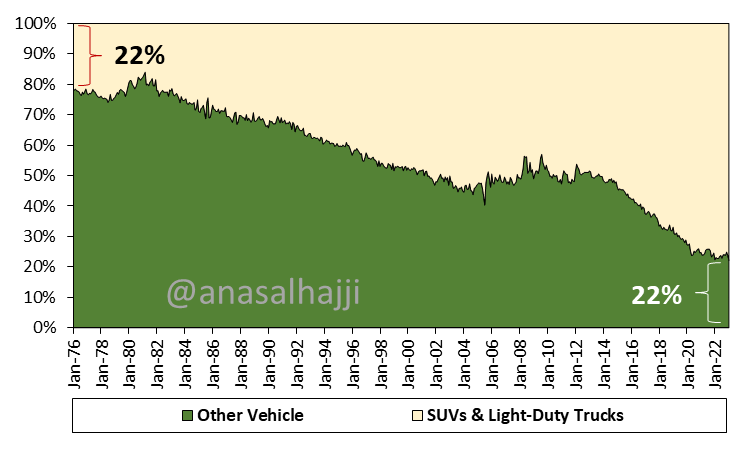
Figure (1)
US Vehicles Sales (%)
Source: FED, 2023, and EOA, 2023
Commentary
This is a continuation of the discussion we started in yesterday’s DER about the oil demand of the US transportation sector, and the International Energy Agency’s report about SUVs and light trucks. Figure (1) above shows US vehicle sales by type, and the change in consumers’ tastes over a period of almost 50 years from small cars to SUVs, crossovers, and light-duty trucks. The percentage of SUVs and light-duty trucks was 22% in 1976, while that of small cars was 78%. Now, however, it is exactly the opposite.


