


Daily Energy Report
US crude supply days, Rig count, Harris energy advice, CA solar cost, Canada crude to China, UK offshore wind failure, Canada rail line strike, UK energy bills, and more.

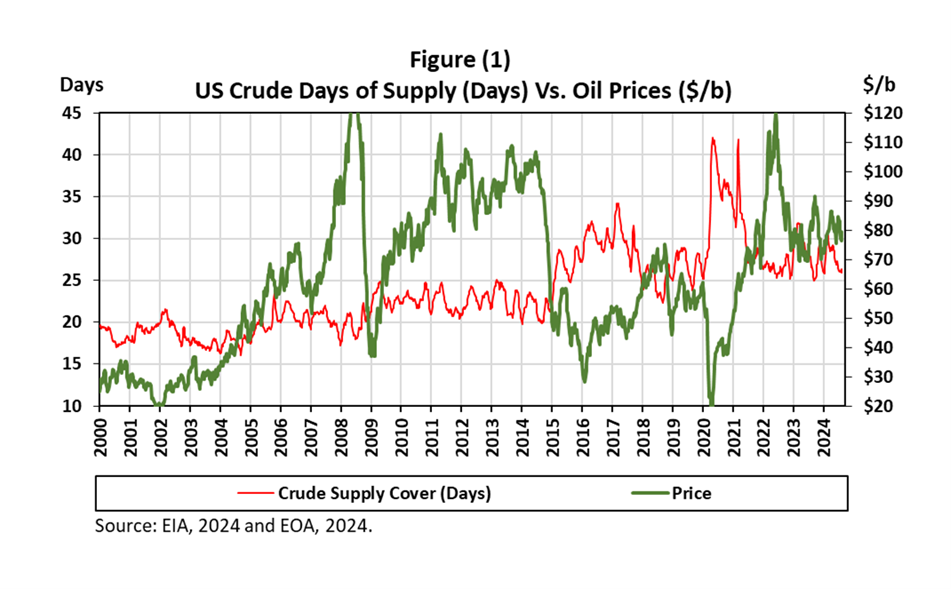
The Inverse Relationship Between US Crude Inventories Days of Cover and Oil Prices
Summary
Changes in inventories are proxies for supply and demand. Price volatility increases when actual inventories deviate from expectations. If changes in inventories meet expectations the impact on oil prices is limited.
Looking at the US or OECD crude inventories alone does not tell the whole story. We must put that within a certain context. An easy and quick way, albeit insufficient, is to look at inventories in terms of expected demand— for instance, looking into how many days inventories will last, assuming there is no other source of supply. That is what Figure (1) above is about. It shows US crude oil inventories in terms of supply cover. The Figure shows a strong inverse relationship between days of cover and oil prices. The Figure is an update to a chart we posted over a year ago.