Chart of the Day: What caused the decline in Norway’s CO2 emissions?
Summary
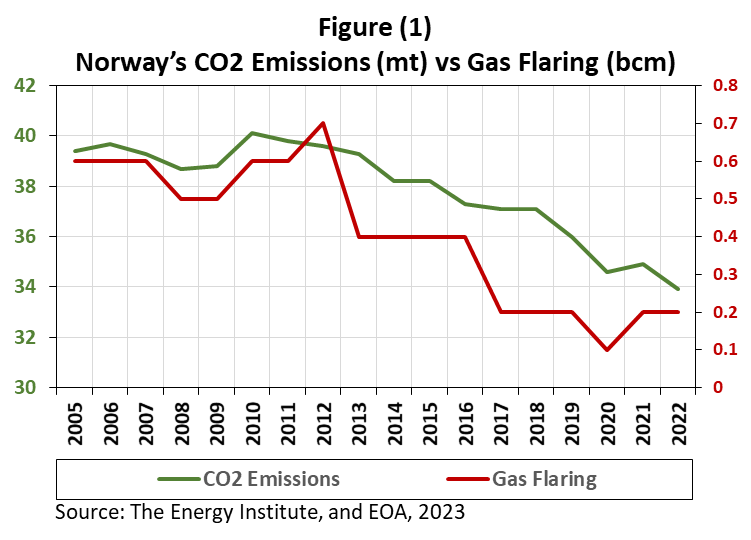
Figure (1) above plots Norway’s CO2 emissions between 2005 and 2022 against the amounts of gas flaring. The chart shows a strong correlation between the two trends.
EOA’s Takeaway
A chart is making the rounds on social media showing Norway’s energy consumption vs CO2 emissions based on data from the Energy Institute Statistical Review of World Energy. It shows a decline in CO2 emissions steeper than the decline in energy consumption. While some commentators wondered about the accuracy of the chart, others wondered why Norway’s CO2 emissions declined faster than energy consumption. A third group attributed the decline to the pentation electric vehicles.
The data in the chart that is making the rounds on social media is correct. But the explanation is in Figure (1) above. Most of the decline in CO2 emissions was caused by a reduction in gas flaring. (We did not start the left axis from zero for clarity). The reduction of electric vehicles is still limited. Just a reminder, most of the electricity generation in Norway comes from hydropower (more than 90%), which makes it an outlier.
To conclude, yes, you might see a chart where reductions in CO2 emissions do not match reductions in fossil fuel consumption if the country is an oil and gas producer and reducing flaring. We might see a case where fossil fuel consumption increases but CO2 emissions decrease. Iraq is an example: the amount of gas flared is massive, while the country’s fossil fuel consumption is increasing.
Story of the Day
EIA: Texas crude oil production at a record high in May
Summary
The EIA released its report for May 2023. It shows that US crude oil production declined by 15,000 b/d to 12.662 mb/d.
Looking deeper at the data, most of the decline came from New Mexico (-58,000 b/d) and the Gulf of Mexico (-30,000 b/d). Texas production increased by 48,000 b/d to 5.494 mb/d, the highest on record as shown in Figure (2) below.
The EIA also reported a massive increase in demand in May YOY: 699,000 b/d to 20.776 mb/d, a record for the month of May.


