Daily Energy Report
EU gas imports, China car sales up, OPEC+ cut analysis, China oil demand, West turns to Nuclear, Canada emissions cap, Nigeria refining, Shadow tanker runs aground, and more.
Chart of the Day: EU Gas Imports – LNG vs Piped Gas
Summary
Figure (1) above shows EU gas imports by source in November 2023. About 51.4% of total gas imports were piped gas and 48.6% were LNG.
While the largest exporter to the EU is Norway, the second is the US. About a quarter of EU imports come from the US. Russia and Algeria both export gas via pipeline and in the form of LNG to the EU. Each country accounts for about 15% of the EU gas import total.
EOA’s Main Takeaways
LNG continues to play a greater role in the EU’s gas supply mix as the bloc shifts away from Russian energy supplies.
The EU’s LNG imports hit a 6-month high in November, reaching 9.2 million tons (equivalent to 12.59 Bcm of re-gasified LNG), according to the EOA’s compiled ship tracking data. France was the main importer in November with 2.27 million tons, followed by Spain (1.6 million tons) and the Netherlands (1.27 million tons). From the LNG supply side, the US has remained the EU’s top LNG supplier accounting for 52% of delivered imports into the EU, followed by Russia (13%), and Algeria (11%).
Europe has entered the heating season with full gas stockpiles, sufficient to meet its gas needs till the end of the season. If Europe experiences several cold snaps, this will increase the withdrawal rates from gas stockpiles. In this case, a rise in gas prices is expected in Q1 2024, but the increase would be limited by low economic growth and low industrial demand.
Story of the Day
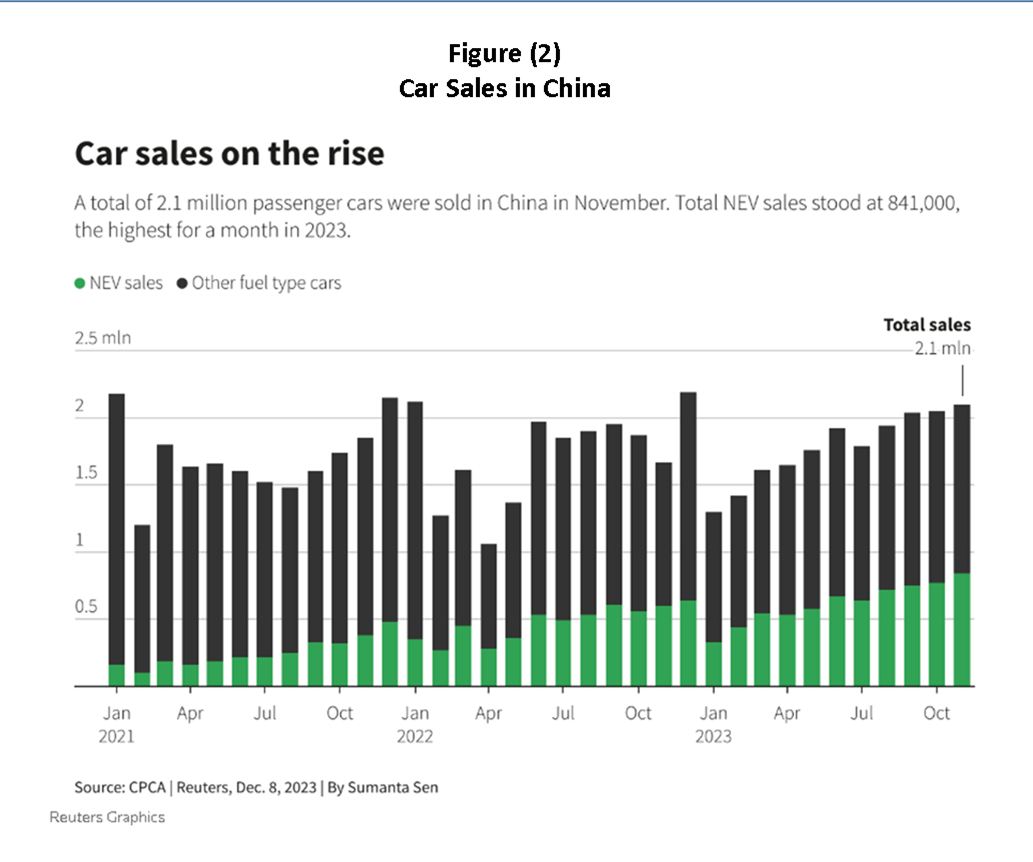
Reuters: China Car Sales Growth Speeds Up in November as Price War Intensifies
Summary
EOA’s Main Takeaways
This is a good news story, and we advise reading it in full by clicking on the link above. Four comments are in order:
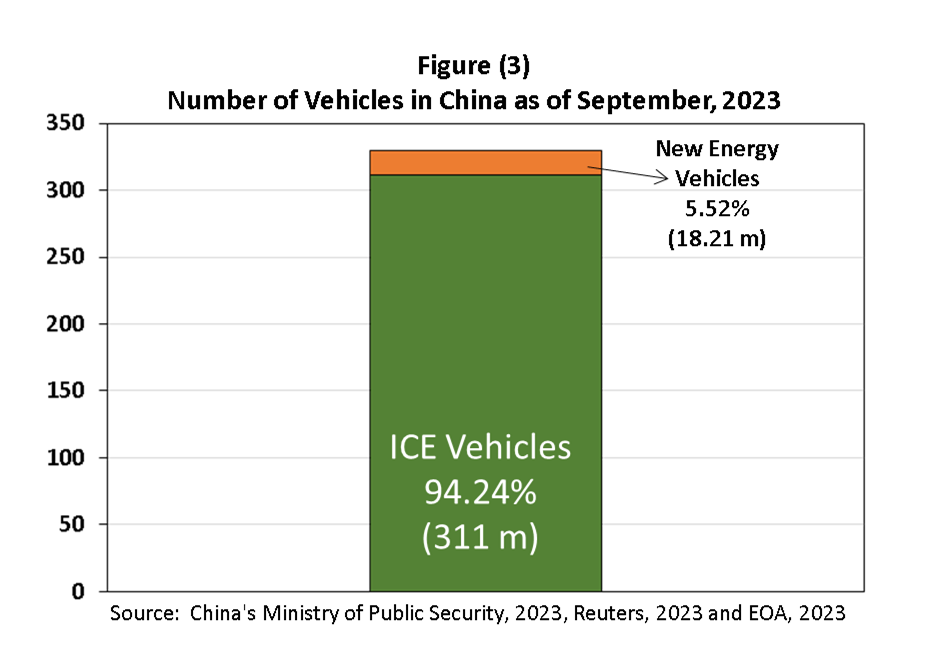
What matters for oil demand is the number of ICE vehicles on the road and their mileage. As long as the numbers are increasing, an increase in EV sales takes from demand growth, not from overall demand. The number of ICE vehicles on the road has NOT declined yet. Let’s avoid the media-biased coverage of EVs. To do this we will avoid the focus on large percentage increases when starting from a low number, which is a common misinformation tactic. See the true picture in Figure (3) below.
Most of the shift in China is from gasoline/diesel vehicles to coal vehicles. By now, our readers are familiar with Figure (4) below.
The accelerated sales in November mean lower demand in the coming months because of the price war that took place.
We at EOA are looking at EVs as a form of oil market management. Without EVs, we would have oil shortages in the coming years. We estimate that without the existence of non-ICE vehicles, “gross” global oil demand today would have been about 1.2 mb/d higher, assuming that those who bought a non-ice vehicle would have purchased an ICE vehicle.
News of the Day
Bloomberg: Why the OPEC+ Cuts Have Flopped
Reuters: Russia & Saudi Arabia Urge All OPEC+ Powers to Join Oil Cuts
Summary
OPEC+ announced additional cuts aiming to reduce oil output by 2.2 million barrels per day in the next quarter, but the market has responded with a price drop. The "real" impact of these cuts is expected to be much less due to previously made commitments and a history of non-compliance by some member states. Angola has already indicated it will not comply with its new output target. Iraq may also fail to meet its promised reduction. Iran says it will increase production.
EOA’s Main Takeaway


