Daily Energy Report
EU Piped gas and LNG imports, China’s declining oil imports, and EIA Inventories
Note: As we mentioned yesterday, due to a scheduling conflict, we will post a short version of the Daily Energy Report today.
Chart of the Day: EU Natural Gas Imports by Source
Summary
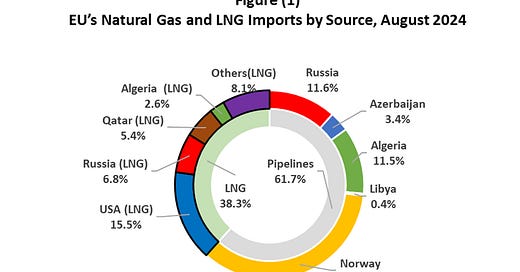
Figure (1) shows EU’s gas imports by source. It shows that 61.7% of total gas imports came through pipelines while 38.3% arrived in the form of LNG. Pipeline imports came from Russia (11.6%), Azerbaijan (3.4%), Algeria (11.5%), Libya (0.4%), and Norway with the lion’s share of 34.8%.
LNG imports came from the US (15.5%), Russia (6.8%), Qatar (5.4%), Algeria (2.6%), and from others (8.1%). Combining pipelines and LNG, the largest exporter of natural gas is Norway, followed by Russia, the US, and Algeria.


